In my team at Gazin, we faced a memory usage problem while running tests as our projects grew. At the beginning, since our stack is Node/React, we opt by using Jest as our test runner for all projects for the sake of simplicity. However, as our projects grew Jest was using a lot of RAM, especially running frontend tests. At first, we tried to optimize our tests and even use @swc/jest as our transpiler. Both attempts failed. We believe that part of the issue is related to bug 11956. After that, I set out to look for a viable alternative and to measure its efficacy.
Procpath
First, I needed a tool to measure memory usage of a process, or many of them, with accuracy. As I use Linux for development, I found a tool called Procpath that can inspect Linux's process tree. With it we can get many useful metrics like CPU usage and various forms of memory usage metrics, like Resident Set Size (RSS), Proportional Set Size (PSS) and Unique Set Size (USS).
Which metric to use?
Like I said, Procpath provide us many memory usage metrics and their differences are:
- RSS: Total memory allocated in RAM including the total size of all shared libraries
- PSS: Mesures total allocated RAM, but includes only a proportional amount of pages of shared libraries
- USS: This metric only measures unique pages of the process.
Here I decided to use Unique Set Size to measure.
Measuring Jest
With procpath we can use procpath query <query string> to inspect the current process tree.
As I wanted to find any processes that were related to Jest, I used the following query
to find all processes that had "jest" in their executable path:
procpath query "$..children[?("jest" in @.cmdline)]"Using that command while the test suite ran gave me a bunch of processes which implied that I was in the right direction.
Now I needed to keep pooling and recording that information while the whole test suite ran, luckily procpath had a command for that:
sudo procpath record -i 1 -d jest.sqlite "$..children[?("jest" in @.cmdline)]" -f smaps_rollup,stat,cmdlineHere I used the flag -i to define a pooling interval of 1 second and
-d defines the name of the output file.
The -f flag define some extra attributes necessary to measure USS
At last, I used the plot command to create a graph of memory usage (USS):
procpath plot -q uss -d jest.sqlite -f jest.svg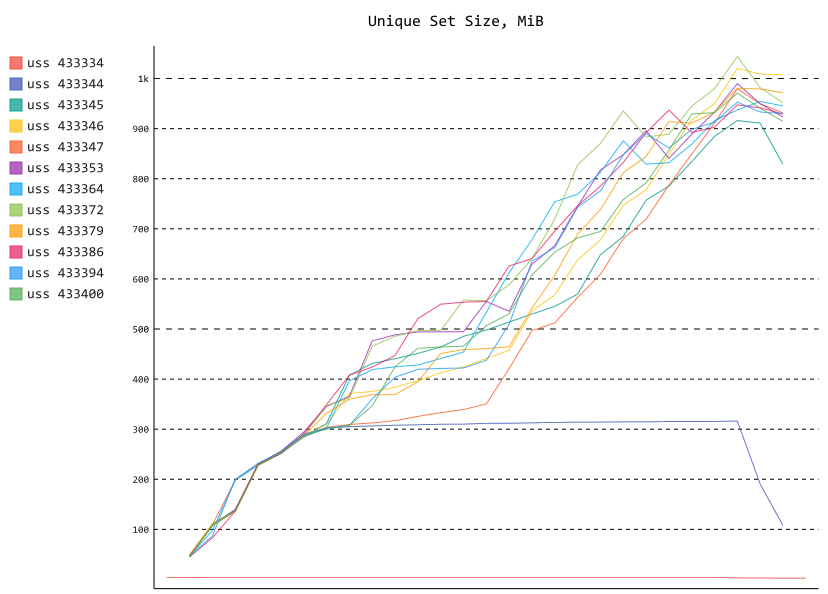
As we can see, Jest creates 11 child processes (the lowest process is procpath recording jest), almost all of them consume around 1Gib each at peak.
Putting it together
Since we have a bunch of processes, we need to sum their usages to get the actual metric.
We can do that using the following query against jest.sqlite and exporting it as JSON.
This query is a group by of the default query in procpath:
.mode json
.once jest-aggr.json

select
    ts,
    SUM((smaps_rollup_private_clean + smaps_rollup_private_dirty) / 1024.0) USS
from record group by ts;
With this data I used PyPlot to create an aggregate usage graph:
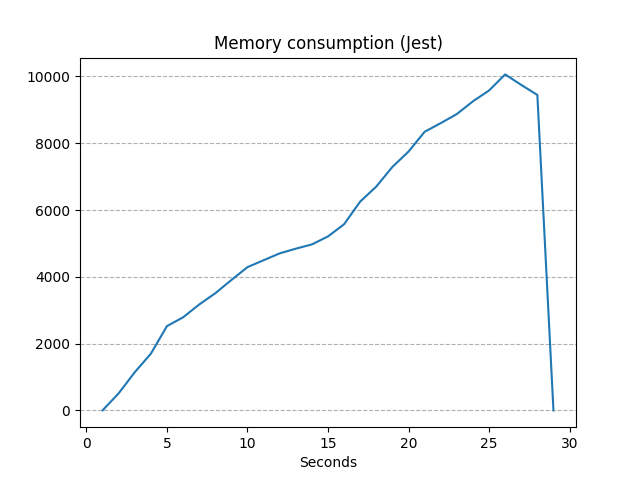
This graph scared me, but just by looking the memory usage in tools like htop
I could see it was in fact correct. Now I had a process to follow to measure optimizations or
other changes in the code.
Vitest
The most viable alternative I wanted to test out (which ended up being the only one) was Vitest, a testing framework based on Vite and with an API almost identical to Jest, offering an easy migration. Besides that Vitest also has a better support for ESM modules, a feature that is still not fully supported in Jest
Following the migration guide, I turned globals on, and change all references from
jest to vi, for instance:
- const bar = jest.fn()
+ const bar = vi.fn()
I also had to change all calls from jest.requireActual to vi.importActual:
vi.mock('react-router-dom', async () => {
-  const actual = jest.requireActual('react-router-dom')
+  const actual: object = await vi.importActual('react-router-dom')

  return {
    ...actual,
    useHistory: () => vi.fn()
  }
})
I also had a problem with the library @testing-library/jest-dom
we use because it uses @types/jest under the hood, which overrides some Vitest globals typings.
To get the typings back I exported Vitest globals again in a .d.ts file in our project:
const { SuiteAPI, TestAPI, SuiteHooks } = require('vitest')

declare const suite: SuiteAPI<{}>
declare const test: TestAPI<{}>
declare const describe: SuiteAPI<{}>
declare const it: TestAPI<{}>

declare const beforeAll: (
  fn: SuiteHooks['beforeAll'][0],
  timeout?: number | undefined
) => void
declare const afterAll: (
  fn: SuiteHooks['afterAll'][0],
  timeout?: number | undefined
) => void
declare const beforeEach: (
  fn: SuiteHooks['beforeEach'][0],
  timeout?: number | undefined
) => void
declare const afterEach: (
  fn: SuiteHooks['afterEach'][0],
  timeout?: number | undefined
) => void
With these changes I was able to run our tests using Vitest successfully.
Comparing frameworks
Now that I had Vitest working, I followed the same process I used before to compare the memory usage with Jest, and these are the results:
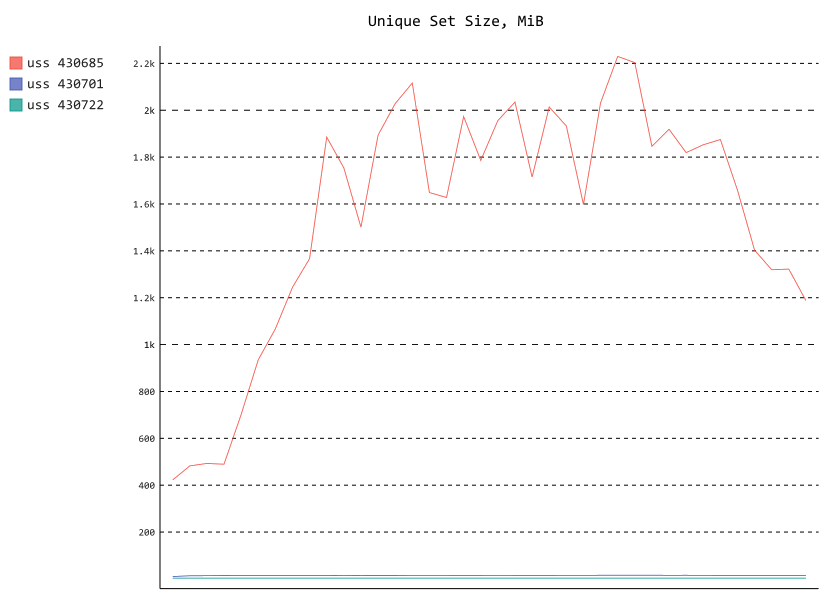
Since Vitest mainly uses threads to achieve parallelism, we only see three processes above, one of them is procpath again, one is esbuild, and the big one is the vitest runner. For simplicity, I will not consider esbuild and will not make a new aggregate graph.
Finally, I used PyPlot again to make a comparative graph of Jest x Vitest:
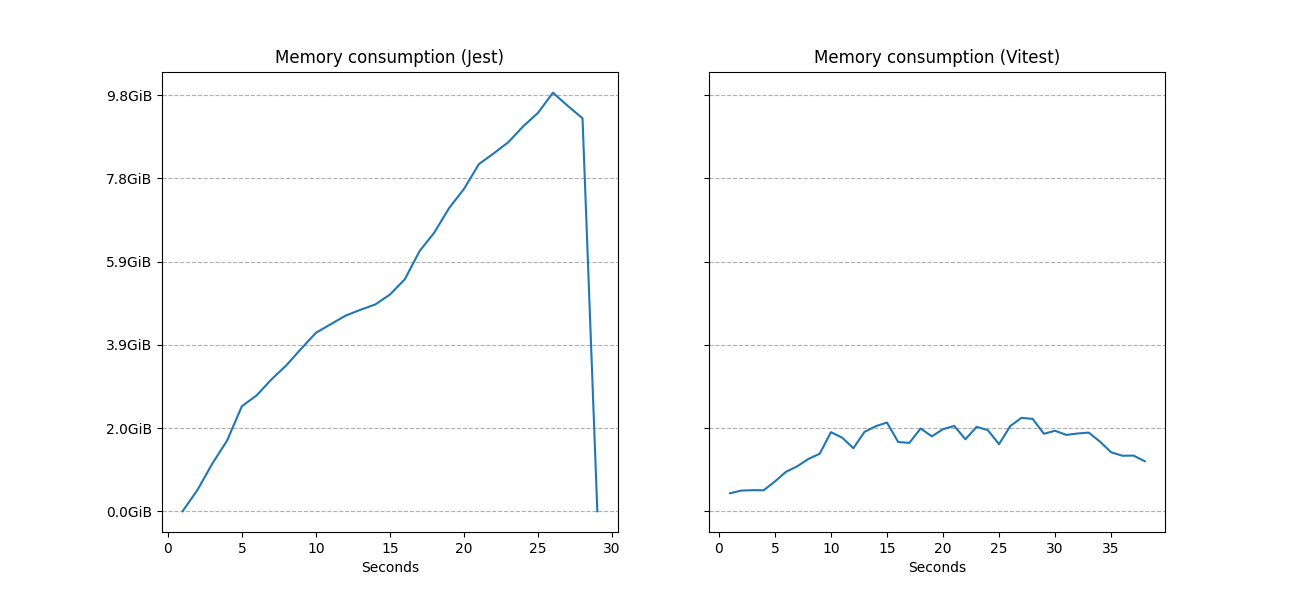
As we can see, even though Vitest takes a little longer to run the test suite, we have a stable memory usage, while Jest increasingly uses more RAM.
Wrapping up
It's needless to say that Vitest solved our problem while being mostly a drop-in replacement of Jest. By changing frameworks, we also got ahead in supporting ESM modules natively, something that has kept us from using some libraries in the past.